
插件目录 / UI & Skins / dsh-ui-tool-graph
dsh-ui-tool-graph
已验证 · 实测可装 rocklau
功能简介
Tool-call value graph tab for the DeepSeek Harness (dsh) Web UI: cost/duration/error weights over conversation trajectories with one-click next-turn optimization prompts.
可用 — 实测通过,早期项目
Tool-call value graph tab for the DeepSeek Harness (dsh) Web UI: cost/duration/error weights over conversation trajectories with one-click next-turn optimization prompts. 实测能干净安装、正常启动。早期项目,但功能可用。
「已验证」表示我们的自动化 CI 在干净 profile 里实际执行了 dsh plugin add 并启动成功——仅此而已。功能描述与版本兼容性均为作者声明。这不是安全审计,也不代表对第三方代码的背书。
README
dsh-ui-tool-graph
A tool-call value graph tab for the DeepSeek Harness (dsh) Web UI.
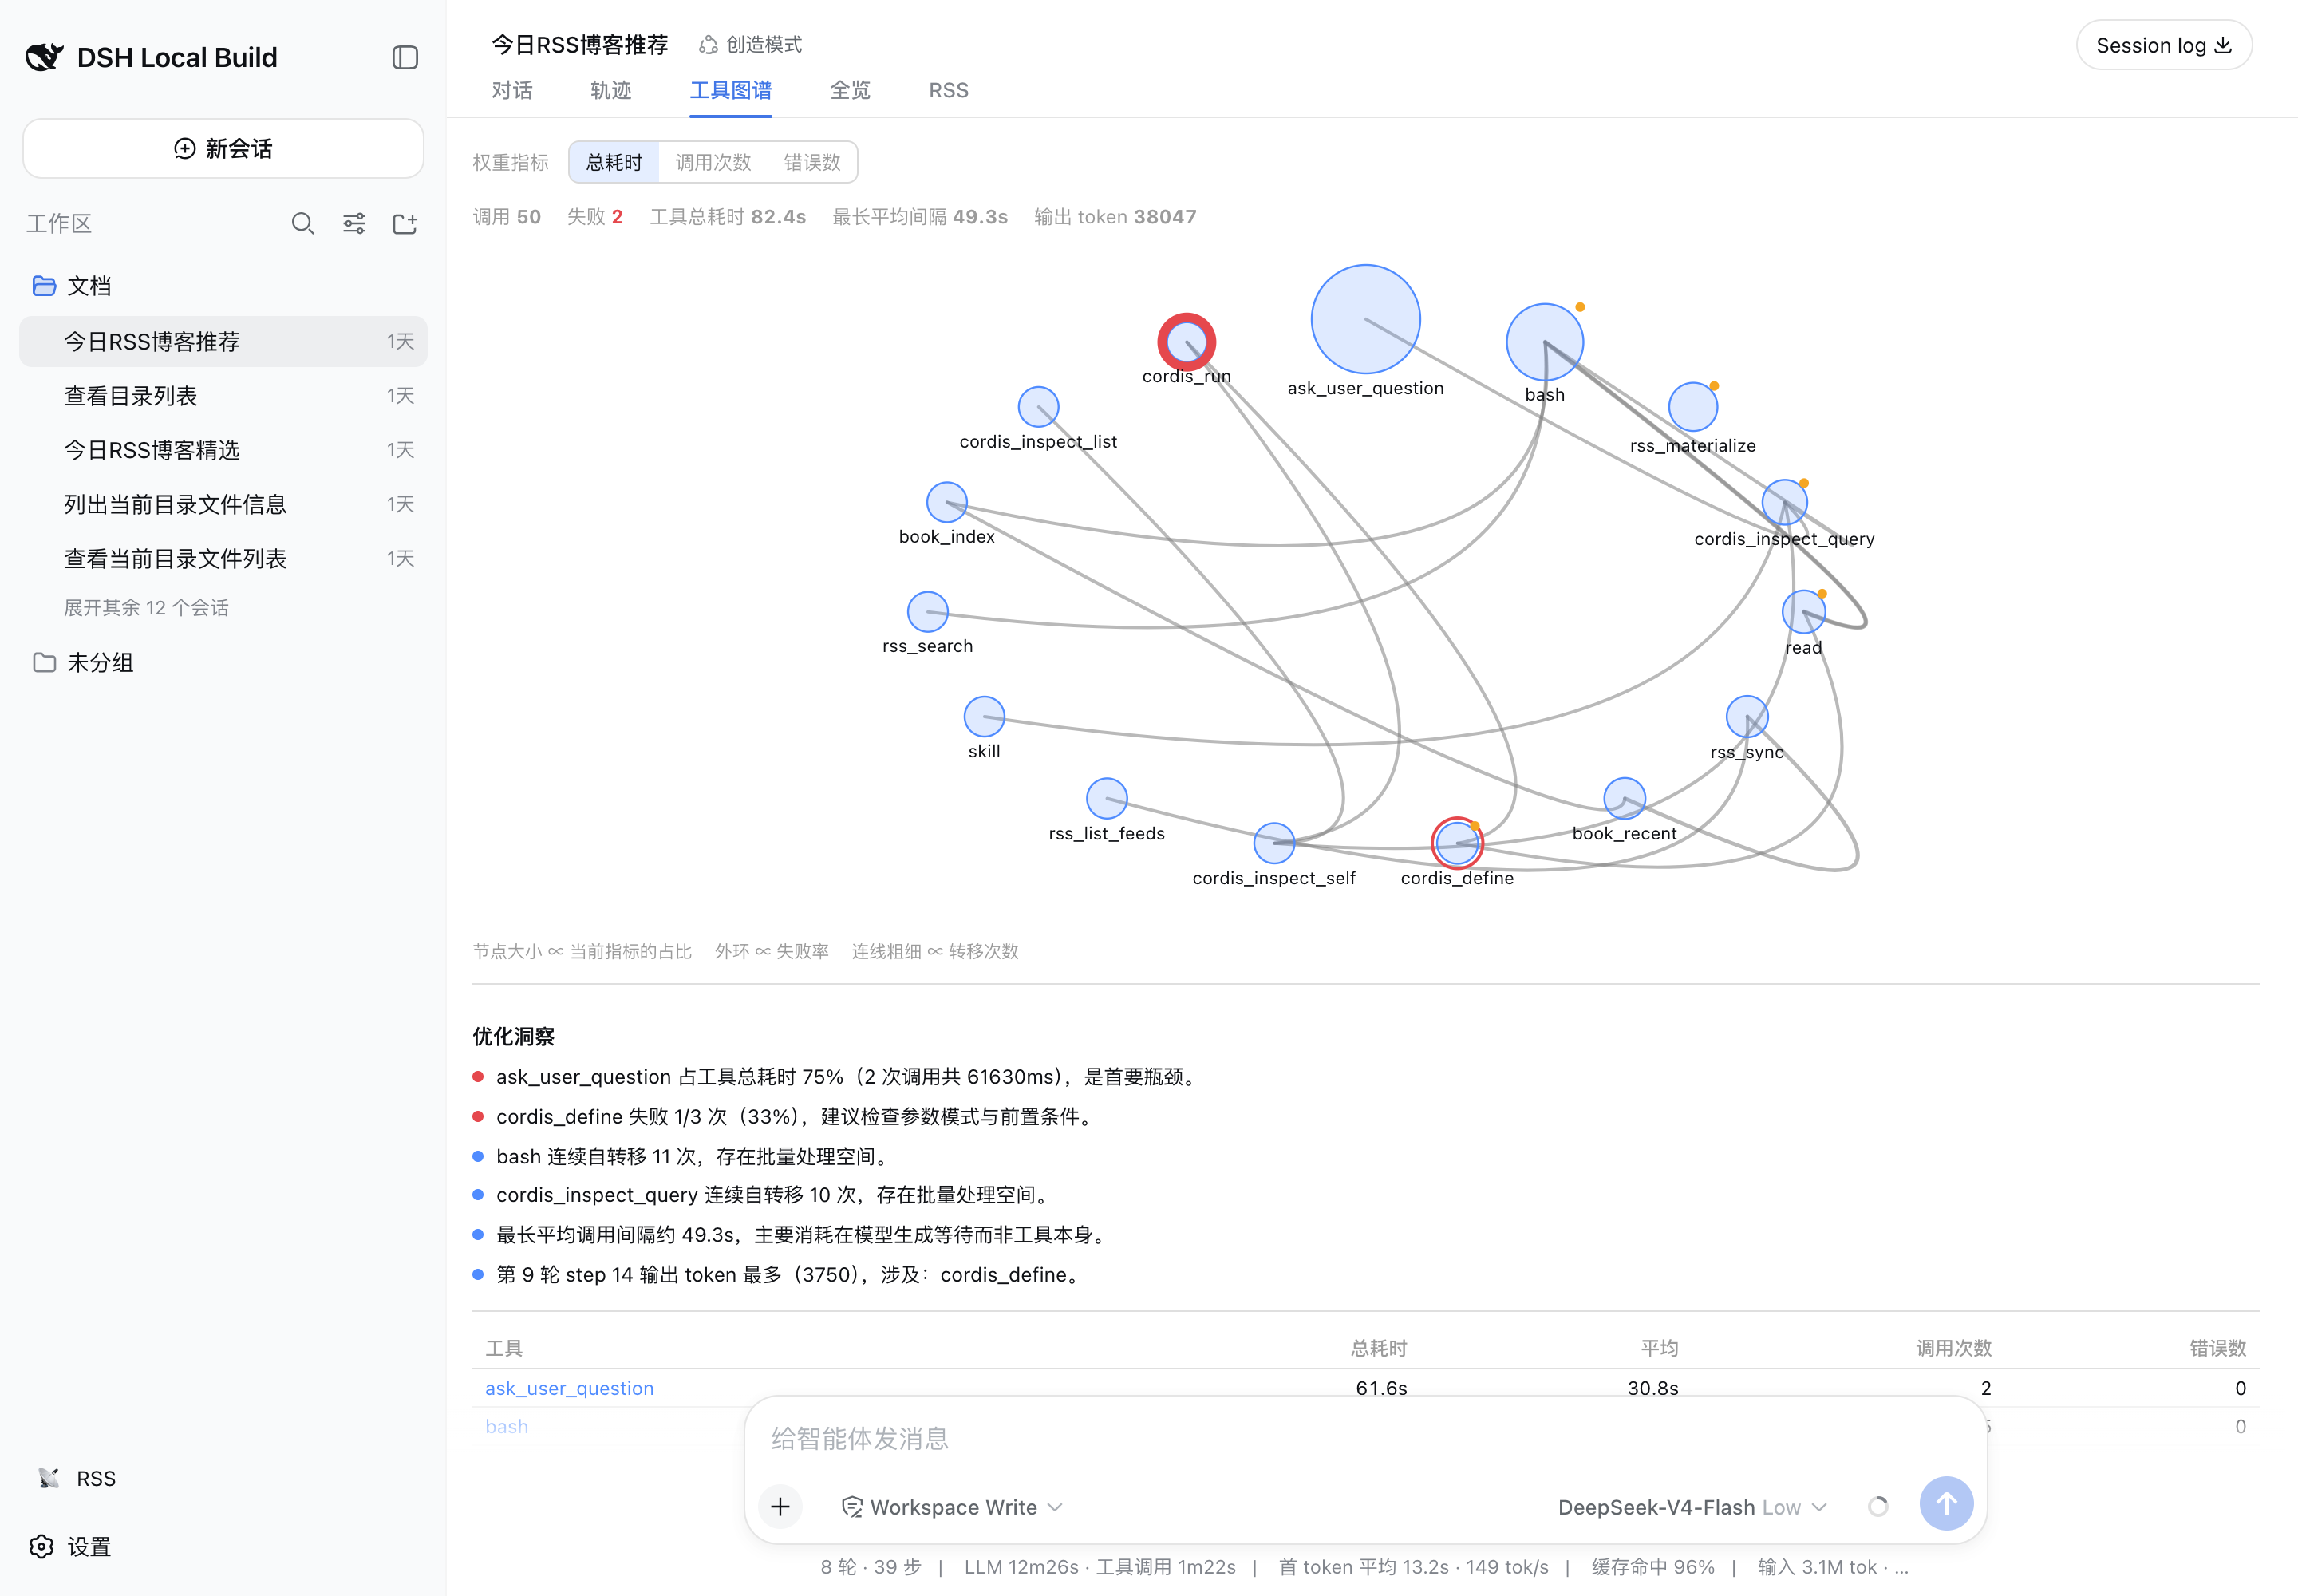
Agent trajectories bury their own economics: which tool ate the wall time, where calls failed, how many tokens each round burned, which calls repeated themselves verbatim. This plugin adds a Tool Graph (工具图谱) tab to the conversation view ring that folds the session log into one weighted relationship graph:
- Nodes are tools, sized by the metric you pick (total duration, call count, errors) with an outer ring proportional to the error rate;
- Edges are transitions, one per consecutive dispatch pair within a turn, weighted by transition count;
- Insights call out the dominant bottleneck, error-prone tools, identical repeat calls, self-loops worth batching, the longest inter-call wait, and the step that produced the most output tokens;
- Next-turn guidance renders those metrics into a self-contained analysis prompt you can copy to the clipboard or queue as your literal next message.
Everything is folded client-side from the durable session log — deterministic, replay-safe, no extra model calls, no persistence, zero token cost.
Features
- Weighted radial graph — switch node weighting between total duration / call count / errors at any time; edge width ∝ transition count.
- Optimization insights — rule-derived findings with severity dots: bottleneck share, error-prone tools, verbatim repeats (cache/dedup candidates), consecutive same-tool chains, model-generation waits, token-heavy steps.
- Per-tool ranking table — total / average duration, calls, errors; click a row or node to drill into every individual call with its duration and argument excerpt.
- Session totals strip — calls, running, failures, tool wall time, longest average gap, output tokens.
- One-click next turn — copy the analysis prompt, or send it as your next queued message after an explicit second click.
Installation
Tarball from a release (no build-script permission needed):
dsh plugin --profile web add https://github.com/rocklau/dsh-ui-tool-graph/releases/download/v0.1.2/dsh-ui-tool-graph-0.1.2.tgz
Or from source:
dsh plugin --profile web add github:rocklau/dsh-ui-tool-graph
A git install fetches sources, so pnpm runs this package's prepare script on first add; follow the CLI's prompt to allow the build in the profile's pnpm-workspace.yaml, then re-run the command. Restart dsh web afterwards — the 工具图谱 tab appears in every session header.
Uninstall: dsh plugin --profile web remove dsh-ui-tool-graph.
How it works
| Metric | Definition |
|---|---|
| Call duration | tool/result time − paired tool/call time (wall clock) |
| Tool wall time | Sum over completed calls in the loaded window |
| Error rate | Error results ÷ completed calls per tool |
| Transition edge | Consecutive call pair within one turn, in log order |
| Average gap | Per-edge mean of result→next-start latency (dominated by model generation wait) |
| Tokens | Provider usage carried by each finalized assistant message, deduplicated per step |
The view target folds incrementally (replace/apply over the event window), so totals cover exactly what the history window holds; page older turns in the Trajectory tab to extend coverage.
Known limitations
- Nested sub-calls (delegations) fold as their parent result only.
- The LLM-vs-tool wall-time split is approximated by inter-call gaps; per-request timing attribution is not yet surfaced.
- Single-tool sessions render one node without edges — by definition.
Development
pnpm install
pnpm typecheck   # tsc --noEmit (strict)
pnpm test        # vitest: folding parity, layout purity, prompts, component behavior
pnpm build       # lib/index.js (node half) + lib/client.js (browser bundle)
pnpm pack        # installable tarball
The package is a dual-identity bundle: dsh.bundle ships the patch layer, dsh.client declares the web plugin. Runtime imports are limited to the host-shared module table (react/cordis/client-runtime); everything else is bundled.
License
MIT
安装
装一次目录插件,之后本站所有插件都能让 DeepSeek Harness 自动找、自动装:
dsh plugin add dshbase-catalog然后对 agent 说「帮我装 dsh-ui-tool-graph」,它会在目录里找到并自动安装。文档:dshbase-catalog · 已验证场景包。
该插件是 GitHub 源码(未发 npm)——直接从仓库装:
Web profile:
dsh plugin --profile web add github:rocklau/dsh-ui-tool-graphHeadless(CLI)profile:
dsh plugin --profile headless add github:rocklau/dsh-ui-tool-graph实测报告
验证通过:从 GitHub 源码完成 L1 安装 + L2 加载 + L3 运行(dsh 0.1.0-rc.6)。
分享徽章
把这枚徽章粘进 README——它会链回本页,实测状态变化时自动更新:

[](https://dshbase.com/zh/plugins/dsh-ui-tool-graph/)<a href="https://dshbase.com/zh/plugins/dsh-ui-tool-graph/"><img src="https://dshbase.com/badges/dsh-ui-tool-graph.svg" alt="dshbase 实测可装"></a>